█ Click a button to navigate to the relevant section.
Vision and Strategy
Korean Re continues to advance its vision of becoming a truly global top-tier reinsurer. Moving beyond ranking-driven aspirations, we are committed to qualitative excellence rather than mere quantitative expansion. Our focus remains on strengthening underwriting expertise, financial resilience, risk management discipline, and superior client service — the fundamental pillars of sustainable competitiveness.
Our mid-term strategic slogan, “Challenge Ourselves, Change the World,” reflects our commitment to cultivating a corporate culture grounded in innovation, accountability, and continuous improvement. It embodies our determination to transcend conventional boundaries, embrace transformation, and proactively shape the future of the global reinsurance market. By constantly challenging ourselves, we aim not only to respond to change, but also to lead it.
Across both reinsurance underwriting and investment operations, we will actively pursue AX and DX initiatives to maximize operational efficiency. This presents an optimal opportunity to streamline our organization, reduce rising expenses, enhance productivity per employee, and fundamentally improve our cost structure.
Through digital acceleration and process innovation, we aim not only to enhance efficiency but also to strengthen our long-term competitiveness in an evolving market environment.
In 2025, we achieved the milestone of securing an S&P A+ rating — an accomplishment realized for the first time in 11 years since obtaining an A rating in 2014. This upgrade affirms Korean Re’s growth potential and global competitiveness, signifying that we have evolved beyond an Asia-centered reinsurer into a capable global market player. We will leverage this new rating across our organization to maximize its impact on business development and market expansion. Indeed, it will mark the beginning of our full-fledged leap toward becoming a truly global top-tier reinsurer. Going forward, our journey of overcoming challenges and embracing transformation will continue.
Overview of Business Environment
In 2025, the Korean insurance market recorded solid premium growth, driven by both the life and non-life sectors, although profitability weakened compared to the previous year.
In the life insurance market, growth was primarily supported by continued strong sales of protection-type products and a steady expansion in the retirement pension business. Insurers maintained their focus on higher-margin protection products under the IFRS 17 framework to reinforce portfolio profitability. While savings insurance showed a slight decline, the overall growth momentum in the life segment remained robust.
In the non-life insurance market, long-term insurance and general property and casualty (P&C) lines delivered stable growth, reflecting sustained demand for protection coverage. However, motor insurance premiums declined due to rate adjustments and slower growth in the number of insured vehicles. Meanwhile, liability-related lines continued to show firm demand, contributing to the expansion of the general insurance business.
Despite stronger premium growth, overall profitability declined in 2025, as weaker insurance service results offset improvements in investment performance. Although investment income benefited from a KOSPI rally and stable interest and dividend income, rising loss ratios and pressure on underwriting margins weighed on insurance operating results. Consequently, key profitability indicators, including ROA and ROE, declined compared to the previous year.
The IFRS 17 and K-ICS frameworks continued to shape insurers’ strategic priorities in 2025. Most insurers remained focused on enhancing product margins, strengthening portfolio quality, and actively managing capital adequacy through the issuance of subordinated debt and hybrid capital instruments, as well as expanding the use of reinsurance and coinsurance. While asset growth and capital levels remained stable, insurers are expected to maintain a cautious stance amid ongoing financial market volatility and broader macroeconomic uncertainties.
Highlights of Business Results
█ Key Figures
(Units: KRW billion, USD million)
| 2025 (KRW) | 2025 (USD) | 2024 (KRW) | 2024 (USD) | |
| Gross Written Premiums | 8,220.8 | 5,730.8 | 7,924.8 | 5,791.1 |
| Insurance Revenue (gross)1) | 4,975.8 | 3,468.7 | 5,136.6 | 3,753.6 |
| Insurance Service Result (net) | 226.5 | 157.9 | 198.7 | 145.2 |
| Insurance Finance Result (net) 2) | -215.0 | -149.9 | -183.5 | -134.1 |
| Technical Result 2) | 11.5 | 8.0 | 15.2 | 11.1 |
| Investment Income 3) | 475.1 | 331.2 | 389.3 | 284.5 |
| Net Income | 322.0 | 224.5 | 316.7 | 231.4 |
| ROE | 9.0% | 9.4% | ||
1) Income from insurance contracts issued
2) Excluding exchange rate effects
3) Excluding the insurance finance result and gains/losses from foreign exchange and interest rate hedging for insurance liabilities
Korean Re delivered stable financial performance in 2025 while continuing to strengthen the quality and diversification of its business portfolio. Our gross written premiums (GWP) increased by 3.7% year on year to KRW 8,220.8 billion, while insurance revenue declined by 3.1% to KRW 4,975.8 billion. As we maintained disciplined underwriting and focused on improving investment performance, our net income increased to KRW 322.0 billion, with a return on equity (ROE) of 9.0%.
There was an improvement in the insurance service result, which amounted to KRW 226.5 billion in 2025, reflecting strengthened underwriting discipline and enhanced operational performance. However, our technical result, which includes the insurance service result and insurance finance result, declined by KRW 3.7 billion year on year to KRW 11.5 billion. The decrease was mainly attributable to a loss in the insurance finance result, which widened to KRW 215.0 billion in 2025 from KRW 183.5 billion in the previous year due to changes in market-based assumptions.
Meanwhile, active portfolio management enabled us to diversify our global business portfolio, increasing our presence in Europe and the Americas, which accounted for a greater share of the total business. According to a geographical breakdown of our gross written premiums, markets in Europe and the Americas accounted for 31.3% and 29.8%, respectively, of the entire overseas business portfolio in 2025. Their combined share reached 61.1% in 2025 compared to 57.6% in the prior year. It is also noteworthy that the share of the Asian market declined to 35.5% in 2025 compared to the previous year as a result of our portfolio adjustments aimed at improving overall business results.
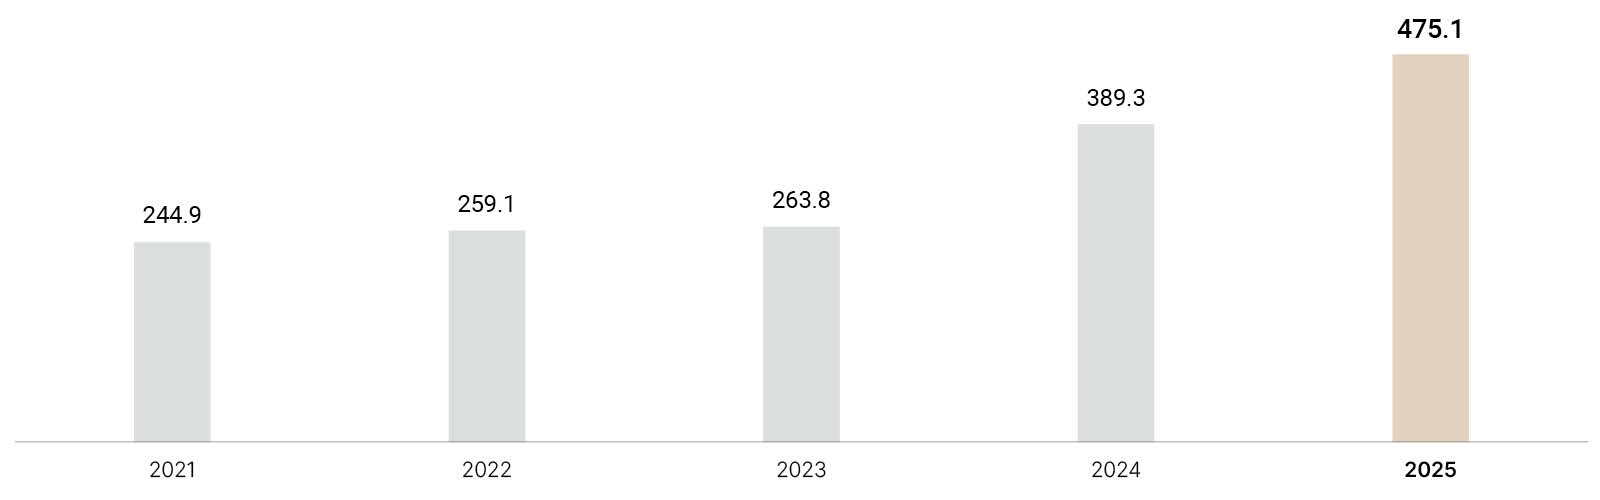
We achieved strong investment performance for the year, with investment income rising by KRW 85.8 billion to KRW 475.1 billion. The increase was supported by stable interest and dividend income as well as favorable equity market performance. While financial market volatility and discount rate movements under IFRS 17 continued to affect earnings volatility, we maintained a stable capital position supported by steady net income generation.
The total value of our assets continued to grow in line with our business expansion. We reported KRW 14,259.8 billion in total assets as of the end of 2025, up KRW 1,099.4 billion year over year. There was a substantial increase of KRW 1,081.2 billion in invested assets, which totaled KRW 11,915.3 billion. This growth was mainly driven by an increase in net cash inflows from insurance operations and asset valuation gains following changes in foreign exchange rates and interest rates. Moreover, our capital position remained solid, with total shareholders’ equity increasing to KRW 3,683.4 billion as of the end of December 2025. The increase in total shareholders’ equity from the previous year is primarily due to our stable net income performance.
█ Overseas Business Portfolio* by Region in 2025
(Unit: %)
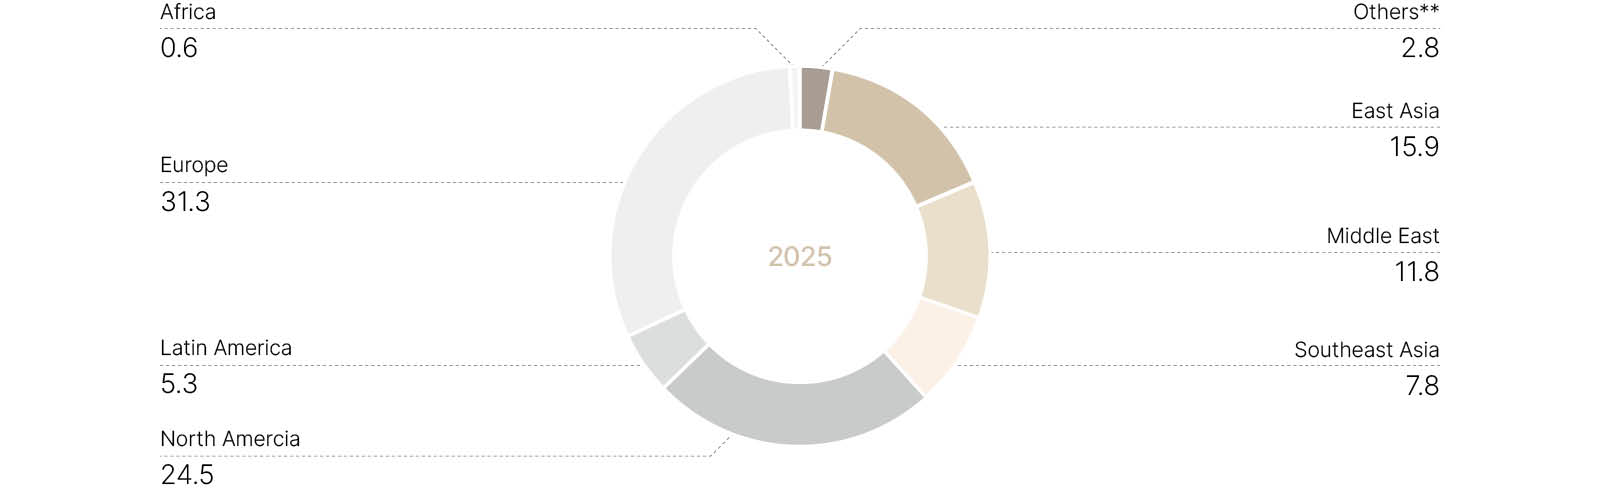
* Based on gross written premiums
** Others include multi-territory accounts.
█ Breakdown of Insurance Revenue by Line of Business
(Units: KRW billion, USD million)
| 2025 (KRW) | 2025 (USD) | 2024 (KRW) | 2024 (USD) | YoY Change 3) | |
| Property1) | 1,735.4 | 1,209.8 | 1,744.3 | 1,274.7 | -0.5% |
| Marine & Aviation | 468.3 | 326.4 | 457.9 | 334.6 | 2.3% |
| Casualty | 1,054.6 | 735.1 | 1,111.4 | 812.2 | -5.1% |
| Motor | 364.6 | 254.2 | 448.7 | 327.9 | -18.7% |
| Long-Term | 608.6 | 424.3 | 613.3 | 448.2 | -0.8% |
| Life & Health | 711.0 | 495.7 | 730.5 | 533.8 | -2.7% |
| Financial Solutions | 33.3 | 23.2 | 30.4 | 22.2 | 9.5% |
| Total1) | 4,975.8 | 3,468.7 | 5,136.6 | 3,753.6 | -3.1% |
1) Property includes engineering and nuclear.
2) Individual figures may not add up to the total shown due to rounding.
3) YoY change is based on the value in KRW.
█ Domestic Insurance Revenue Portfolio by Line of Business
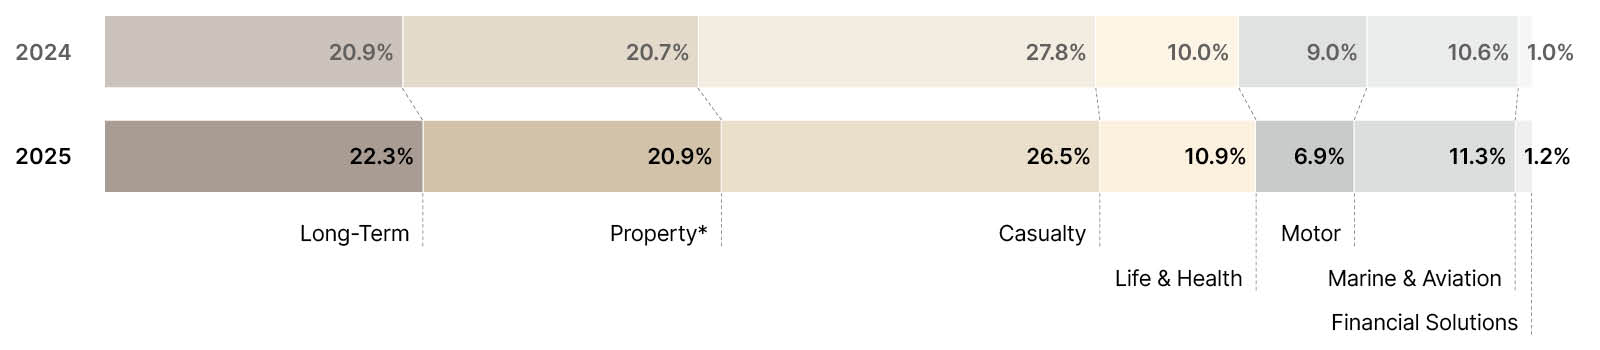
* Property includes engineering and nuclear.
█ Overseas Insurance Revenue Portfolio by Line of Business

* Property includes engineering and nuclear.
Analysis of Business Results
Property and Casualty (P&C) Reinsurance
█ P&C Key Figures
(Units: KRW billion, USD million)
| 2025 (KRW) | 2025 (USD) | 2024 (KRW) | 2024 (USD) | |
| Insurance Revenue (gross) 1) | 3,622.9 | 2,525.5 | 3,762.3 | 2,749.4 |
| Domestic | 1,787.4 | 1,246.0 | 2,020.3 | 1,476.3 |
| Overseas | 1,835.5 | 1,279.5 | 1,742.1 | 1,273.0 |
| Insurance Service Result (net) 2) | 282.5 | 197.0 | 348.4 | 254.6 |
| Insurance Finance Result (net) 3) | -84.8 | -59.1 | -65.1 | -47.6 |
| Technical Result 2) 3) | 197.7 | 137.9 | 283.3 | 207.0 |
| Combined Ratio (%) 4) | 88.2 | 85.7 |
||
1) Income from insurance contracts issued
2) The 2024 figures have been restated to reflect a change in the calculation method, whereby other insurance expenses are excluded from insurance service expenses.
3) Excluding exchange rate effects
4) The combined ratio is calculated as insurance service expenses (net) divided by insurance revenue (net). The 2024 figure has been restated to reflect a change in the calculation method, whereby other insurance expenses are excluded from insurance service expenses.
Our P&C insurance revenue decreased from KRW 3,762.3 billion in 2024 to KRW 3,622.9 billion in 2025, marking a 3.7% decline. Domestic insurance revenue fell by 11.5% to KRW 1,787.4 billion in 2025 due to portfolio adjustments. Throughout the year, we placed a strategic focus on strengthening our business portfolio and improving our long-term profitability. Accordingly, we restricted growth targets to prioritize reinforcing our business fundamentals and significantly reduced our underwriting volume for low-profitability contracts.
On the other hand, overseas P&C insurance revenue increased by 5.4% to KRW 1,835.5 billion in 2025, driven by the expansion of new treaties and rate increases in some markets. This growth in the overseas market partially offset the revenue decline in the domestic market.
The P&C insurance service result decreased by 18.9% to KRW 282.5 billion in 2025 from KRW 348.4 billion in 2024, while the technical result fell by 30.2% to KRW 197.7 billion in 2025. Although the year saw lower attritional losses, a rise in large-loss activity had an adverse impact on underwriting performance. As a result, the combined ratio rose from 85.7% in 2024 to 88.2% in 2025. Despite higher costs from large loss events, the ratio remained comfortably below 100%, indicating robust underwriting profitability.
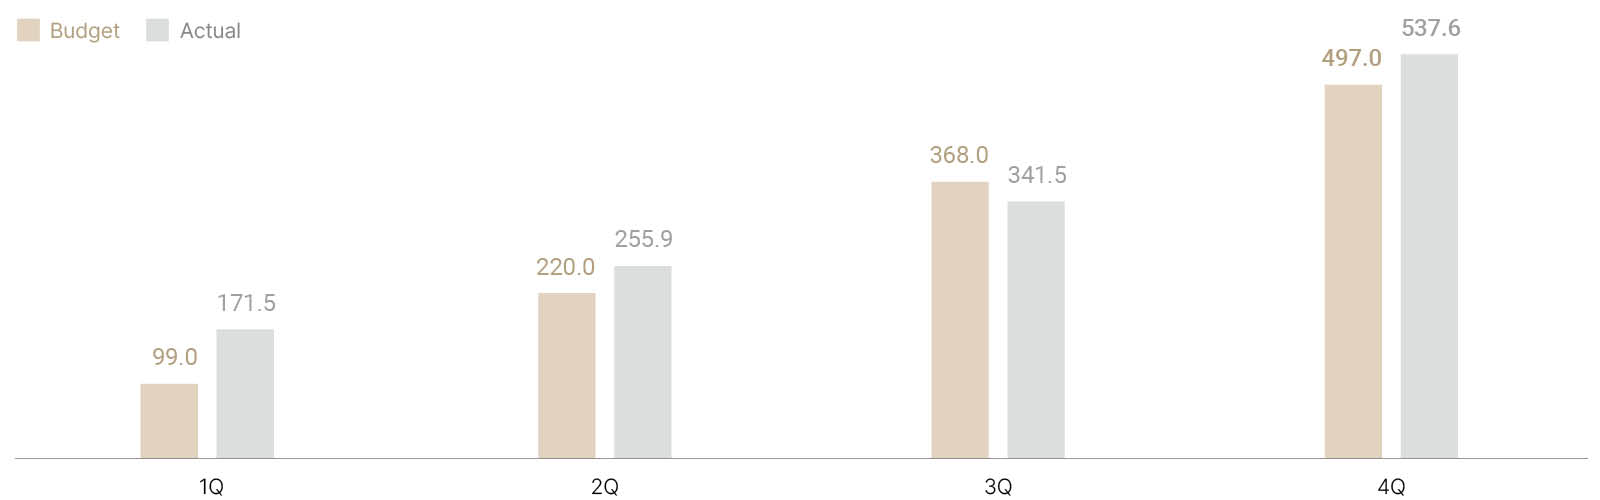
Based on a review of our claim budget established at the beginning of each year, attritional losses were managed within budget expectations. The claim budget represents the annually defined acceptable level of losses required to achieve profit targets. However, in 2025, large losses exceeded our budgeted expectations due to catastrophe events such as the LA wildfires and the Myanmar earthquake, partially offsetting the favorable attritional loss experience.
Building on the underwriting discipline demonstrated in 2025, we are well-positioned to further strengthen our underwriting performance in the years ahead. The market has been responding to increasing claims costs by correcting prices and restricting terms and conditions. In step with these market movements, we will continue to exercise strict underwriting discipline to improve our technical profitability. Favorable pricing dynamics, coupled with our disciplined underwriting approach, are expected to support solid results going forward.
█ Major Large Losses in 2025
(Units: KRW billion, USD million)
| Major Large Losses | Month of Loss | 2025 (KRW) | 2025 (USD) |
| LA Wildfires | Jan. 2025 | 45.9 | 32.0 |
| Myanmar Earthquake | Mar. 2025 | 36.3 | 25.3 |
| Hong Kong Wang Fuk Court Fire | Nov. 2025 | 33.8 | 23.6 |
| Southern Thailand Floods | Nov. 2025 | 33.4 | 23.3 |
| South Korea Yeongnam Wildfires | Mar. 2025 | 24.5 | 17.1 |
█ Claim Budget vs Actual Large Losses in 2025 (Quarterly Cumulative)
(Unit: KRW billion)
Life and Health (L&H) Reinsurance
█ L&H Key Figures
(Units: KRW billion, USD million)
| 2025 (KRW) | 2025 (USD) | 2024 (KRW) | 2024 (USD) | |
| Insurance Revenue (gross) 1) | 1,353.0 | 943.2 | 1,374.2 | 1,004.2 |
| Domestic | 938.4 | 654.2 | 936.2 | 684.1 |
| Overseas | 414.5 | 289.0 | 438.0 | 320.1 |
| Insurance Service Result (net) 2) | 45.8 | 32.0 | -44.3 | -32.4 |
| Insurance Finance Result (net) 3) | -130.2 | -90.7 | -118.4 | -86.5 |
| Technical Result 2) 3) | -84.3 | -58.8 | -162.7 | -118.9 |
| Combined Ratio (%) 4) | 96.5 | 103.3 | ||
| Contractual Service Margin (net) | 967.7 | 667.9 | 953.0 | 642.0 |
1) Income from insurance contracts issued
2) The 2024 figures have been restated to reflect a change in the calculation method, whereby other insurance expenses are excluded from insurance service expenses.
3) Excluding exchange rate effects
4) The combined ratio is calculated as insurance service expenses (net) divided by insurance revenue (net). The 2024 figure has been restated to reflect a change in the calculation method, whereby other insurance expenses are excluded from insurance service expenses.
In 2025, the insurance revenue of Life and Health (L&H) decreased by 1.5% to KRW 1,353.0 billion compared to the prior year. Domestic L&H insurance revenue slightly increased by 0.2% to KRW 938.4 billion, reflecting adjustments in business volume and portfolio strategy, while overseas L&H insurance decreased by 5.4% to KRW 414.5 billion.
From a profitability perspective, our L&H business saw a significant turnaround in 2025. The insurance service result turned positive at KRW 45.8 billion, compared to a loss of KRW 44.3 billion in 2024. This improvement reflects enhanced underwriting discipline and the absence of large-scale precautionary valuation adjustments that had weighed on the prior year’s results. Accordingly, the combined ratio improved significantly to 96.5% in 2025 from 103.3% in 2024, indicating strengthened underwriting profitability and improved risk management.
However, the insurance finance result recorded a loss of KRW 130.2 billion, slightly widening from the previous year, mainly due to discount rate movements and financial market volatility under the IFRS 17 framework. As a result, the technical result remained in deficit, but the loss narrowed substantially to KRW 84.3 billion, compared to KRW 162.7 billion in the previous year.
Following the introduction of IFRS 17, revenue recognition in L&H continues to rely on the amortization of the Contractual Service Margin (CSM), which represents the unearned profit embedded in insurance contracts. As the CSM is released into earnings as insurance contracts are fulfilled as expected, it remains a key indicator of future insurance business performance.
To ensure the robust management of the CSM, which forms the foundation of future earnings, we are committed to meticulously analyzing the intrinsic value of each contract from an actuarial perspective and then incorporating the results into our portfolio strategy. When acquiring new treaties, we measure the Value of New Business (VNB) to verify if the incoming CSM aligns with our targets. For our in-force treaties, we identify loss-making contracts that negatively impact the CSM through the measurement of the Value of In-Force Business (VIF).
By the end of 2025, the CSM increased by 1.5% year on year to KRW 967.7 billion. The increase was mainly supported by the growth in our long-term business and new coinsurance transactions with local insurers in 2025. In light of the CSM movement, we will continue to actively manage the CSM by prioritizing profitable new business and optimizing the inforce portfolio to enhance long-term earnings stability.
Investment Performance
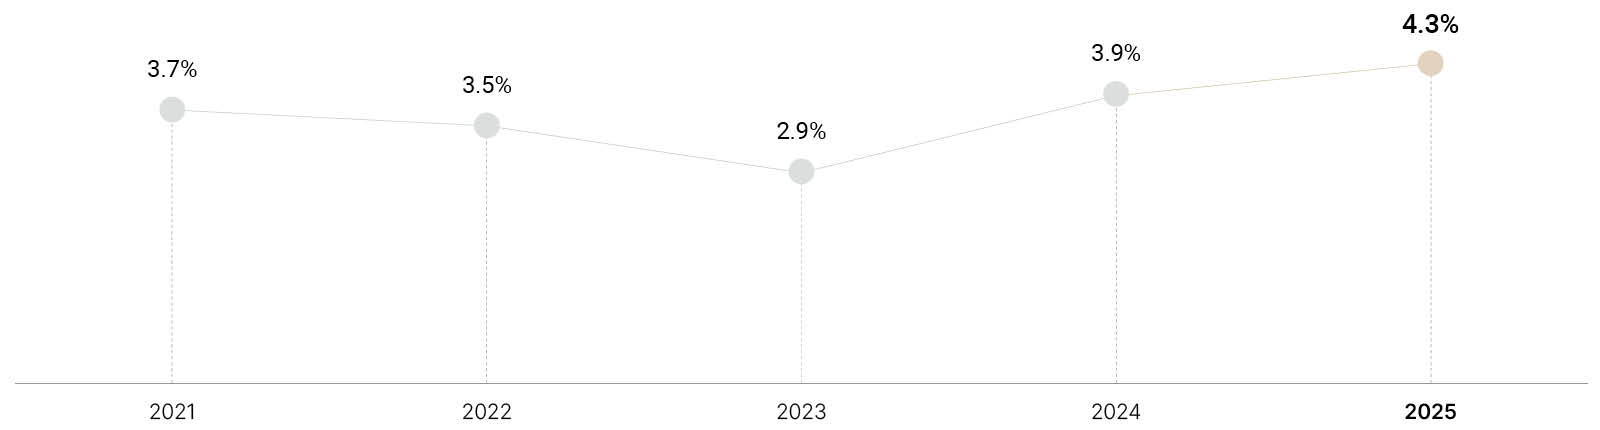
We delivered remarkable investment results with an investment yield of 4.3%, backed by the steady expansion of invested assets and stable net income generation, along with favorable equity market conditions. Our investment profit reached KRW 475.1 billion, excluding the insurance finance result and gains or losses from foreign exchange hedging for insurance liabilities.
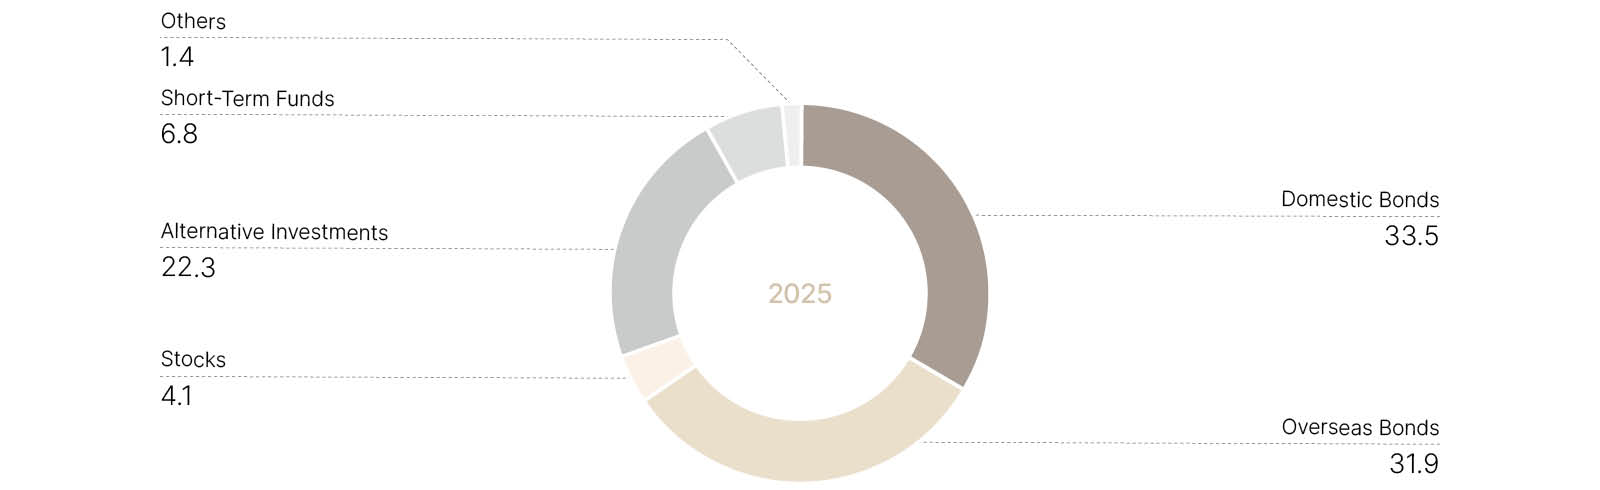
The improvement in investment performance was largely attributable to increased valuation gains driven by a strong stock market rally. Reflecting our positive outlook for a potential rebound in the Korean equity market in 2025, we proactively increased our equity exposure. In the bond portfolio, we focused on acquiring high-yield domestic corporate bonds amid elevated interest rates to enhance portfolio yields, while concentrating overseas bond purchases in the first half of the year in anticipation of potential interest rate declines. In addition, enhancements to our asset management processes enabled us to steadily reduce our allocation to low-yield short-term funds.
Over the next three years, we plan to rebalance our portfolio by gradually adjusting our asset mix in a way that increases portfolio strength and improves overall returns. We will execute this strategy prudently, closely monitoring macroeconomic conditions and market volatility in the face of continued uncertainties.
Within our alternative investment portfolio, we will pursue a balanced approach across corporate investments, real estate, and infrastructure. In particular, we aim to build a balanced infrastructure portfolio by investing in traditional assets that generate stable cash flows, while also allocating capital to AI-related and power infrastructure where strong growth momentum is expected.
We will also respond proactively to major regulatory developments to ensure stable investment performance, while exploring new investment opportunities to further enhance overall profitability.
█ Investment Portfolio Mix in 2025
(Unit: %)
█ Investment Income
(Unit: KRW billion)
* Excluding gains/losses from foreign exchange and interest rate hedging for insurance liabilities for 2021 – 2025 and the insurance finance result for 2022 – 2025
█ Investment Yield
* Excluding gains/losses from foreign exchange and interest rate hedging for insurance liabilities for 2021 – 2025 and the insurance finance result for 2022 – 2025
** The investment yield from 2023 is based on IFRS 9, while the rest are based on IAS 39.
Liquidity
Korean Re maintains sufficient liquidity to meet all financial obligations under both stable and uncertain conditions. In 2025, liquid assets increased by 0.4% (KRW 12.2 billion) compared to the previous year-end, while average insurance claims rose by 2.6% (KRW 33.9 billion). The liquidity ratio declined from 254.7% to 249.2%, but remained at a sound and stable level.
To maintain an adequate liquidity ratio, we operate and maintain bank overdraft facilities to prepare for potential liquidity stress events, such as losses from alternative investments or large-scale insurance claim payments.
As of late 2025, the size of our bank overdraft facilities stood at KRW 40 billion. In addition, we continue to enhance the management of our foreign currency liquidity, including that of our overseas branches. As part of these efforts, we utilize foreign currency money market fund (MMF) transactions to ensure a more efficient and stable liquidity management system.
█ Liquidity Ratio
(Units: KRW billion, USD million)
| 2025 (KRW) | 2025 (USD) | 2024 (KRW) | 2024 (USD) | |
| Liquid Assets (A) 1) | 3,319.9 | 2,291.3 | 3,307.7 | 2,228.3 |
| Average Claims Paid (B) 2) | 1,332.4 | 919.6 | 1,298.5 | 874.8 |
| Liquidity Ratio (A/B) | 249.2% | 254.7% | ||
1) Liquid assets (A): current assets with remaining maturities of 3 months or less
2) Average claims paid (B): average claims paid for a 3-month period
Capital Strength
Korean Re always aims to optimize its capital structure and hold sufficient capital in excess of solvency requirements, thus generating a strong solvency margin ratio (or K-ICS ratio). In 2025, our K-ICS ratio increased by 6.1%p to 197.8% compared to the previous year thanks to our stable net income growth driven by enhanced insurance and investment income.
Despite the switching of the solvency margin ratio system from the RBC regime to the K-ICS regime in 2023, as well as the associated increase in confidence levels related to capital requirements measurement, we have maintained a robust K-ICS ratio, demonstrating our financial health.
Korean Re maintained efficient capital management by issuing new hybrid capital securities in line with the requirements of regulatory authorities and the expectations of credit rating agencies. This has enabled us to maintain a sound solvency margin ratio and to further strengthen our balance sheet as evidenced by our credit rating upgrade to A+ (Stable) by S&P Global Ratings. Utilizing the buffer on the capital, we have been able to grow in more profitable businesses and diversify the portfolio. In the long term, we will pursue organic growth of capital from consistently solid net income results and CAT reserve accumulation.
█ Hybrid Capital Securities
(Unit: KRW billion)
| Issue Date | Coupon | 2025 | 2024 | |
| 3rd issuance | May 30, 2022 | 4.90% | 230 | 230 |
| 4th issuance | Oct. 28, 2022 | 6.70% | 100 | 100 |
| 5th issuance | Mar. 16, 2023 | 5.50% | 250 | 250 |
| 6th issuance | Oct. 11, 2024 | 4.27% | 230 | 230 |
| Total | 810 | 810 | ||
█ Solvency Margin Ratio
| 2025 | 2024 | YoY Change | |
| Solvency Margin Ratio (K-ICS Ratio*) |
197.8% |
191.7% | 6.1%p |
* The ratio refers to the solvency margin ratio under the Korean Insurance Capital Standard (K-ICS).
Credit Ratings
The financial strength of a reinsurer is one of the most critical factors for primary insurers when selecting reinsurance counterparties. Korean Re remains committed to maintaining a robust financial position, backed by sound risk-based capitalization and stable earnings.
S&P Global Ratings: A+ (Stable)
In July 2025, S&P Global Ratings (S&P) upgraded Korean Re’s Financial Strength Rating to A+ from A, with a Stable outlook. This upgrade reflects S&P’s assessment of our strengthened capital position and consistent underwriting performance. According to the rating agency, the upgrade was driven by Korean Re’s “very strong capital adequacy” and its ability to maintain a strong market position while successfully navigating the transition to IFRS 17. S&P highlighted that our increased visibility into future profits and enhanced risk diversification provide a solid foundation for long-term financial stability.
Moody’s Investors Service: A1 (Stable)
Earlier in May 2025, Moody’s Ratings (Moody’s) assigned a first-time Insurance Financial Strength Rating (IFSR) of A1 to Korean Re, with a Stable outlook. This high-grade rating underscores our solid capital base and leading position in the domestic market. Moody’s noted that the rating reflects Korean Re’s disciplined underwriting and the successful implementation of its global diversification strategy, which has bolstered the company’s resilience against localized market volatility.
AM Best: A (Stable) / Long-Term ICR a+ (Stable)
Korean Re’s creditworthiness is further validated by AM Best, which maintains our Financial Strength Rating (FSR) of A (Excellent) and a Long-Term Issuer Credit Rating (Long-Term ICR) of a+ (Excellent). These ratings reflect a balance sheet strength that AM Best assesses as “very strong.”
According to AM Best, our ratings are supported by a noticeable rise in risk-adjusted capitalization—as measured by Best’s Capital Adequacy Ratio (BCAR)—and continued solid profit retention. The agency noted that our strategic restructuring of the business portfolio and the offloading of unprofitable lines have effectively contained underwriting risk. Furthermore, Korean Re has demonstrated sophisticated asset-liability management (ALM), ensuring a stable solvency ratio and resilience against interest rate fluctuations.
█ Credit Ratings of Korean Re
| Rating Agency | Ratings Details | |
| S&P | Financial Strength Rating Local Currency |
A+ / Stable |
| Issuer Credit Rating Local / Foreign Currency |
A+ / Stable | |
| AM Best | Financial Strength Rating | A (Excellent) / Stable |
| Long-Term Issuer Credit Rating | a+ (Excellent) / Positive | |
| Moody’s | Insurance Financial Strength Rating | A1 / Stable |
(As of December 2025)
█ Credit Ratings of Korean Reinsurance Switzerland AG
| Rating Agency | Ratings Details | |
| S&P | Financial Strength Rating Local Currency |
A+ / Stable |
| Issuer Credit Rating Local Currency |
A+ / Stable | |
(As of December 2025)
Dividend and Stock Price Performance
Distributions to Shareholders
Korean Re has a long history of returning value to shareholders based on its consistent dividend policy to offer attractive and sustainable returns to shareholders. Its total dividend payout amount increased by KRW 9.7 billion to KRW 100.7 billion in 2025 due to higher net income, with the payout ratio climbing to 31.3% from 28.7% in the previous year.
We remain committed to delivering consistent shareholder returns, provided that the returns are supported by a level of capital strength that ensures our long-term financial stability.
█ Dividend Performance
| 2021 | 2022 | 2023 | 2024 | 2025 | |
| Total Dividend Amount (KRW billion) | 53.7 | 52.8 | 79.5 | 91.0 | 100.7 |
| Payout Ratio (%)* | 35.0 | 33.4 | 28.0 | 28.7 | 31.3 |
| Dividend per Share (KRW) | 525 | 430 | 540 | 515 | 570 |
| Dividend Yield (%) | 5.5 | 5.9 | 6.8 | 6.8 | 4.6 |
* The payout ratios for 2021 – 2022 are based on IFRS 4, while the 2023-2025 ratios are based on IFRS 17.
Stock Price Performance
In 2025, South Korea’s stock market was marked by a historic rally, with the long-standing “Korea Discount” being significantly diminished. The Korean Composite Stock Price Index (KOSPI) recorded an extraordinary annual growth of approximately 75.6%, the highest among major global markets. Starting at the 2,400 level early in the year, it surged to surpass the 4,000-point milestone in the second half.
This rally was fueled by semiconductor and artificial intelligence (AI) stocks, particularly heavyweight names like Samsung Electronics and SK Hynix, amid rising global demand for AI chips and memory products. The new administration’s Value Up initiatives to support capital markets and corporate reform also helped boost investor confidence in the stock market. Policy measures aimed at improving corporate governance and enhancing shareholder returns heightened market sentiment. Reforms included more explicit fiduciary duties for directors and moves to reduce dividend taxes.
The insurance sector also saw strong growth. The Korea Exchange (KRX) insurance index jumped by 41.0%, mainly driven by heightened expectations for shareholder returns and regulatory relaxation. By year-end, the sector’s market capitalization soared by 45.4%, with life and non-life insurers rising by 62.9% and 31.7%, respectively.
In alignment with this upward trend, Korean Re’s share price increased by 45.1% from KRW 7,950 at the end of 2024 to KRW 11,540 at the end of 2025. While the explosive growth of the semiconductor-heavy KOSPI set a high bar, Korean Re’s trajectory reflects robust earnings, credit excellence, and a consistent dividend policy.
Although the global reinsurance pricing softened in 2025, Korean Re managed to deliver strong net income, reflecting our long-standing focus on prudent underwriting, efforts to strengthen risk management, and reorganizing portfolio toward higher profitability.
It is also worth noting that the company has reached a major milestone, with financial strength and long-term issuer credit ratings upgraded from A (Positive) to A+ (Stable) by S&P. The A+ rating underscores Korean Re’s position not only as a leading reinsurer in Asia but also as a truly global reinsurer.
As of year-end 2025, Korean Re’s stock remains undervalued, with a price-to-book ratio (PBR) of 0.59 or lower. From a valuation perspective, this presents an attractive investment opportunity, further reinforcing the positive outlook for the company.
Other Matters Necessary for Investors
Regarding Material Accounting Policies and Estimates
We prepared financial statements in accordance with the accounting standards adopted by Korea, which are based on the International Financial Reporting Standards (IFRS) issued by the International Accounting Standards Board (IASB), as specified in Article 5(1)1 of the Act on External Audit of Stock Companies.
For details regarding the significant accounting policies applied in the preparation of the financial statements, please refer to the Notes to the Consolidated Financial Statements for 2025, particularly sections “2. Basis of Preparation and Summary of Material Accounting Policies” and “3. Material Accounting Judgments, Estimates, and Assumptions.”
Regarding Matters Concerning Employees
Our company operates employee benefit programs such as financing support for housing purposes, education assistance, and medical support systems to enhance the well-being and job stability of employees. Furthermore, we manage the risks associated with the turnover of key personnel and strengthen organizational competitiveness by incorporating various educational opportunities and individualized professional career management into our human resources administration.
As a reinsurance specialist company, we strive to maintain the highest level of technical expertise and secure specialized personnel to support this endeavor.
Regarding Legal and Regulatory Factors
While regulatory amendments aimed at enhancing the capital strength of insurers and internal controls are underway,
there are no specific regulations scheduled for the next fiscal year that are anticipated to significantly impact our business operations.
Other Matters Necessary for Investors
Regarding Material Accounting Policies and Estimates
We prepared financial statements in accordance with the accounting standards adopted by Korea, which are based on the International Financial Reporting Standards (IFRS) issued by the International Accounting Standards Board (IASB), as specified in Article 5(1)1 of the Act on External Audit of Stock Companies.
For details regarding the significant accounting policies applied in the preparation of the financial statements, please refer to the Notes to the Consolidated Financial Statements for 2025, particularly sections “2. Basis of Preparation and Summary of Material Accounting Policies” and “3. Material Accounting Judgments, Estimates, and Assumptions.”
Regarding Matters Concerning Employees
Our company operates employee benefit programs such as financing support for housing purposes, education assistance, and medical support systems to enhance the well-being and job stability of employees. Furthermore, we manage the risks associated with the turnover of key personnel and strengthen organizational competitiveness by incorporating various educational opportunities and individualized professional career management into our human resources administration. As a reinsurance specialist company, we strive to maintain the highest level of technical expertise and secure specialized personnel to support this endeavor.
Regarding Legal and Regulatory Factors
While regulatory amendments aimed at enhancing the capital strength of insurers and internal controls are underway, there are no specific regulations scheduled for the next fiscal year that are anticipated to significantly impact our business operations.
Outlook
Economic Outlook
Global growth is projected to remain resilient at 3.3% in 2026 before slightly moderating to 3.2% in 2027, according to the International Monetary Fund (IMF). The 2026 forecast marks a slight upward revision compared to late 2025, driven by the balancing of divergent forces: headwinds from shifting global trade policies are being offset by tailwinds from surging investment in AI and technology, particularly in North America and Asia.
Global headline inflation is expected to continue its downward trajectory, declining from an estimated 4.1% in 2025 to 3.8% in 2026 and further to 3.4% in 2027.
While advanced economies are nearing their targets, inflation in the United States is projected to return to target more gradually than previously anticipated due to resilient domestic demand.
Medium-term risks remain tilted to the downside. Key concerns include a potential reevaluation of AI productivity gains, which could trigger financial market corrections, and the possibility of renewed trade tensions. On the upside, faster-than-expected AI adoption and a sustained easing of geopolitical frictions could provide a significant boost to global output.
█ World Economic Outlook
| Real GDP Growth (%) | Estimate | Projections | |
| 2025 | 2026 | 2027 | |
| World | 3.3 | 3.3 | 3.2 |
| Advanced Economies | 1.7 | 1.8 | 1.7 |
| United States | 2.1 | 2.4 | 2.0 |
| Euro Area | 1.4 | 1.3 | 1.4 |
| Germany | 0.2 | 1.1 | 1.5 |
| France | 0.8 | 1.0 | 1.2 |
| Italy | 0.5 | 0.7 | 0.7 |
| Spain | 2.9 | 2.3 | 1.9 |
| Japan | 1.1 | 0.7 | 0.6 |
| Korea | 1.0 | 1.9 | 2.1 |
| United Kingdom | 1.4 | 1.3 | 1.5 |
| Emerging Market and Developing Economies | 4.4 | 4.2 | 4.1 |
| China | 5.0 | 4.5 | 4.0 |
| India | 7.3 | 6.4 | 6.4 |
| Russia | 0.6 | 0.8 | 1.0 |
| Brazil | 2.5 | 1.6 | 2.3 |
| Saudi Arabia | 4.3 | 4.5 | 3.6 |
* For India, data and projections are presented on a fiscal year basis, with FY 2025/26 (starting in April 2025) shown in the 2025 column. India’s growth projections are 6.3% for 2026 and 6.5% for 2027 based on the calendar year.
(Source: IMF, World Economic Outlook Update, January 2026)
Insurance Market Outlook
The global primary insurance market is expected to maintain a steady growth trajectory in 2026, supported by a resilient global economy and the continued normalization of inflation. While the aggressive premium rate hikes seen in previous years have largely moderated, demand remains robust. This is particularly evident in emerging markets and sectors tied to the “green transition” and digital infrastructure, which are driving new premium volume.
In the non-life sector, profitability is projected to remain solid throughout 2026. The industry is benefiting from higher interest rates, which continue to support strong investment income. Furthermore, as inflation stabilizes, the gap between premium growth and claims costs has narrowed, leading to improved underwriting margins across property and casualty lines.
The life insurance sector is also poised for sustained performance. Higher reinvestment yields and a growing middle-class demographic in Asia—specifically in markets like India and Southeast Asia—are fueling sales of savings and protection products, helping the sector maintain a healthy return on equity.
The global reinsurance sector enters 2026 in a position of significant strength. While the pricing cycle has moved past its absolute peak, the market remains “firm,” with reinsurers maintaining strict underwriting discipline. Key highlights for the 2026 outlook include:
• Strong Capitalization: The industry’s balance sheets have reached record levels of resilience, bolstered by the strong earnings of 2024 and 2025. This capital cushion allows reinsurers to absorb the volatility of increasing catastrophe frequency.
• Shift in Focus: As property rates plateau, competition is shifting toward casualty and specialty lines. However, reinsurers remain cautious regarding “social inflation” and litigation trends in Western jurisdictions.
• Technological Transformation: 2026 marks a turning point where AI-driven modeling and advanced data analytics are becoming standard for risk assessment. This transition is helping reinsurers like Korean Re refine their portfolios toward higher-margin business while managing the rising costs of secondary perils.
• Alternative Capital: The catastrophe bond market continues to see high activity, providing essential capacity and helping to stabilize overall market pricing even as demand for protection against climate-related risks grows.
Outlook for Korean Re’s Business in 2026
In 2026, our reinsurance portfolio is projected to grow by approximately 5%, underpinned by disciplined underwriting and continued expansion in strategically selected markets, which is what we call “Smart Growth.” This outlook reflects baseline effects stemming from the previous year’s coinsurance volume as well as our strengthened market presence, particularly following the establishment of our India branch, which commences operations in April 2026 and enhances our access to high-potential markets.
We will continue to pursue a profitability-driven growth strategy, maintaining rigorous underwriting discipline and prudently managing retention levels in lines of business that demonstrate sustainable margins. Although competitive pressures persist amid soft market conditions, we remain committed to selective participation and ongoing portfolio optimization to ensure that growth translates into resilient, risk-adjusted returns.
We expect to achieve an investment yield of approximately 3.9% in 2026, supported by a balanced asset allocation strategy designed to deliver sustainable returns while effectively managing market risks. We will continue to emphasize high-quality assets and diversified investments to reinforce stable income generation.
As of 2025, overseas business accounted for 45.1% of our total portfolio in terms of insurance revenue. With continued international expansion and the launch of our India branch, the share of overseas business is expected to increase further. By establishing a globally diversified portfolio structure, we aim to enhance risk diversification and strategically capture growth opportunities across global markets.
Caution on Forward-Looking Statements
This report contains forward-looking statements, including statements regarding Korean Re’s future operations, strategies, financial condition, and business prospects. These statements are based on current expectations and assumptions and are subject to risks and uncertainties that could cause actual results to differ materially.
Korean Re undertakes no obligation to update or revise any forward-looking statements to reflect future events or circumstances.
Risk Management Report
Risk Management Framework
Our risk management framework upholds an efficient and effective risk management environment to support the achievement of the company’s business goals and strategies. The framework sets out how Korean Re defines, manages, monitors, and reports risks based on its risk governance.
Objectives
Korean Re implements enterprise risk management initiatives to achieve a stable set of risk management objectives. The objectives are as follows:
• Continuously enhancing shareholder value
• Maintaining a high level of credibility with stakeholders, credit rating agencies, and supervisory agencies
• Diversifying insurance and investment portfolios, while also enhancing risk management with regard to overseas business growth
Strategic Risk Management
Korean Re’s business strategy is aligned with its risk management strategy and risk appetite. The Risk Appetite Framework provides the main direction to steer the company as it moves forward, with all risks managed under this framework. Based on the capital plan and financial targets linked to our risk appetite, we establish business plans and operate the business in a stable manner by monitoring and evaluating business performance according to risk indicators.
Risk Appetite Framework
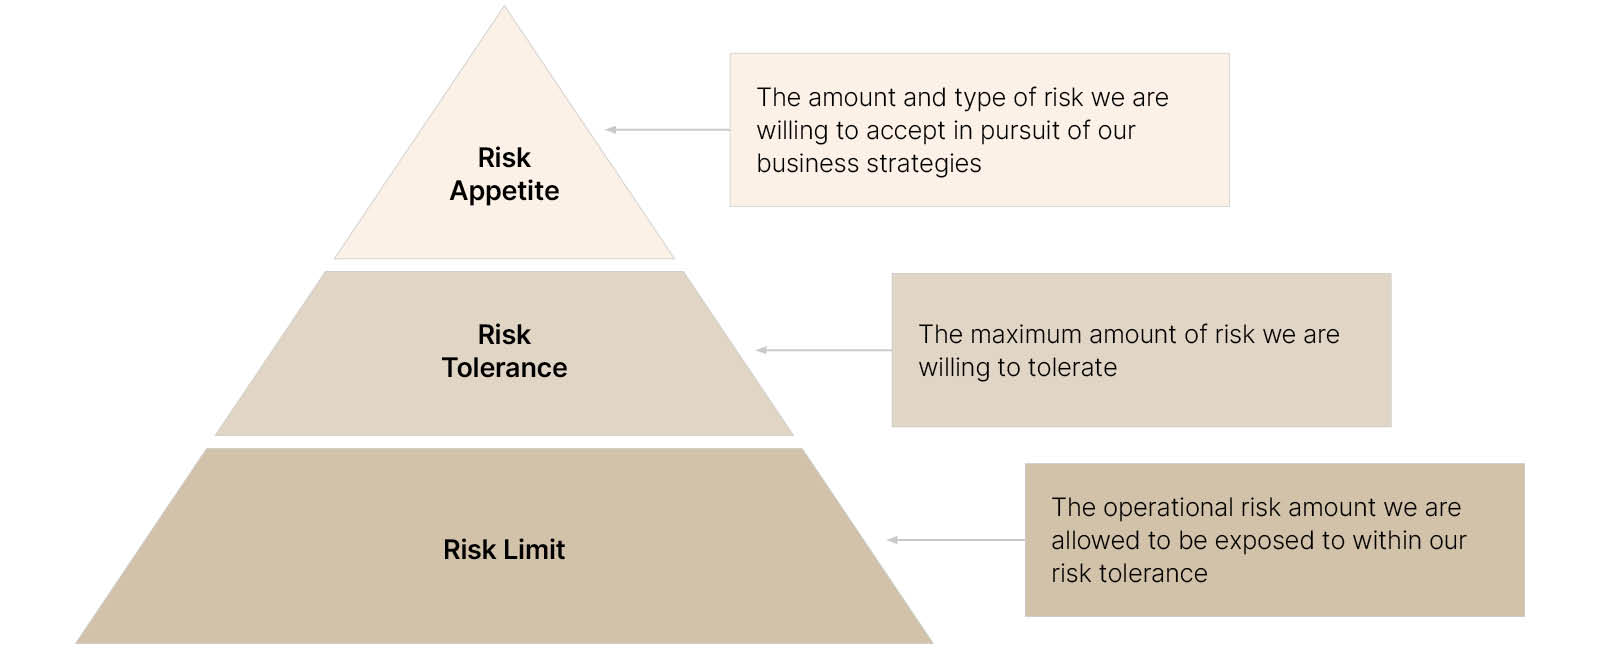
Korean Re’s risk appetite framework is an enterprise-wide risk management guideline made up of three important components: risk appetite, risk tolerance, and risk limit. Risk appetite defines the amount of risk we should accept in consideration of the company’s vision and business objectives. The risk appetite statement is as follows:
• Maintain the solvency ratio within an optimal range (160%-200%)
• Focus on our comparative advantage businesses and achieve a target ROE
• Diversify our insurance and investment portfolios through overseas growth
• Continue to improve our risk-adjusted profitability (RAROC)
Risk appetite plays a significant role in maintaining our risk profile within the boundaries defined by different objectives, such as profitability, solvency, growth, and liquidity. Risk appetite also provides a solid foundation for decision-making with regard to strategic asset allocation, capital planning, portfolio management, and more.
Risk tolerance represents a quantitative level of risk acceptance within the risk appetite and helps create macro guidelines for capital adequacy, liquidity, and concentration. The risk tolerance statement is as follows:
• Maintain the solvency ratio within a stable range (above 130%)
• Maintain a credit rating of A or above
• Ability to meet day-to-day financial obligations (liquidity)
Risk limit describes the risk capacity constraints determined by capital and liquidity resources to ensure compliance with our risk appetite and risk tolerance.
█ Risk Appetite Framework
Capital Management
Korean Re’s capital is managed through a framework which provides a robust foundation for capital management. To ensure Korean Re’s sound capital management, we align our risk management strategy with our long-term business strategy. Strategic objectives are examined from the perspective of our risk management strategy to be certain if they are in accordance with our risk appetite, and the results are then reflected in our business plans. We also have a detailed capital management plan in place based on the levels of solvency ratio in order to maintain the optimal range of solvency. Korean Re’s capital management framework is comprised of three main modules: capital planning, business planning, and risk planning. Each module is structured to ensure full compliance with Korean Re’s risk appetite and tolerance.
Portfolio Optimization
Korean Re performs business planning by analyzing the risks and profitability of its businesses. We measure return on risk-adjusted capital (RORAC) for each line of our insurance business and investment asset portfolio through our own internal model. Based on this, the Strategic Planning Office draws up plans for optimal portfolios and then finalizes annual plans that can achieve capital efficiency with respect to risk appetite and improve our RORAC.
Risk Governance
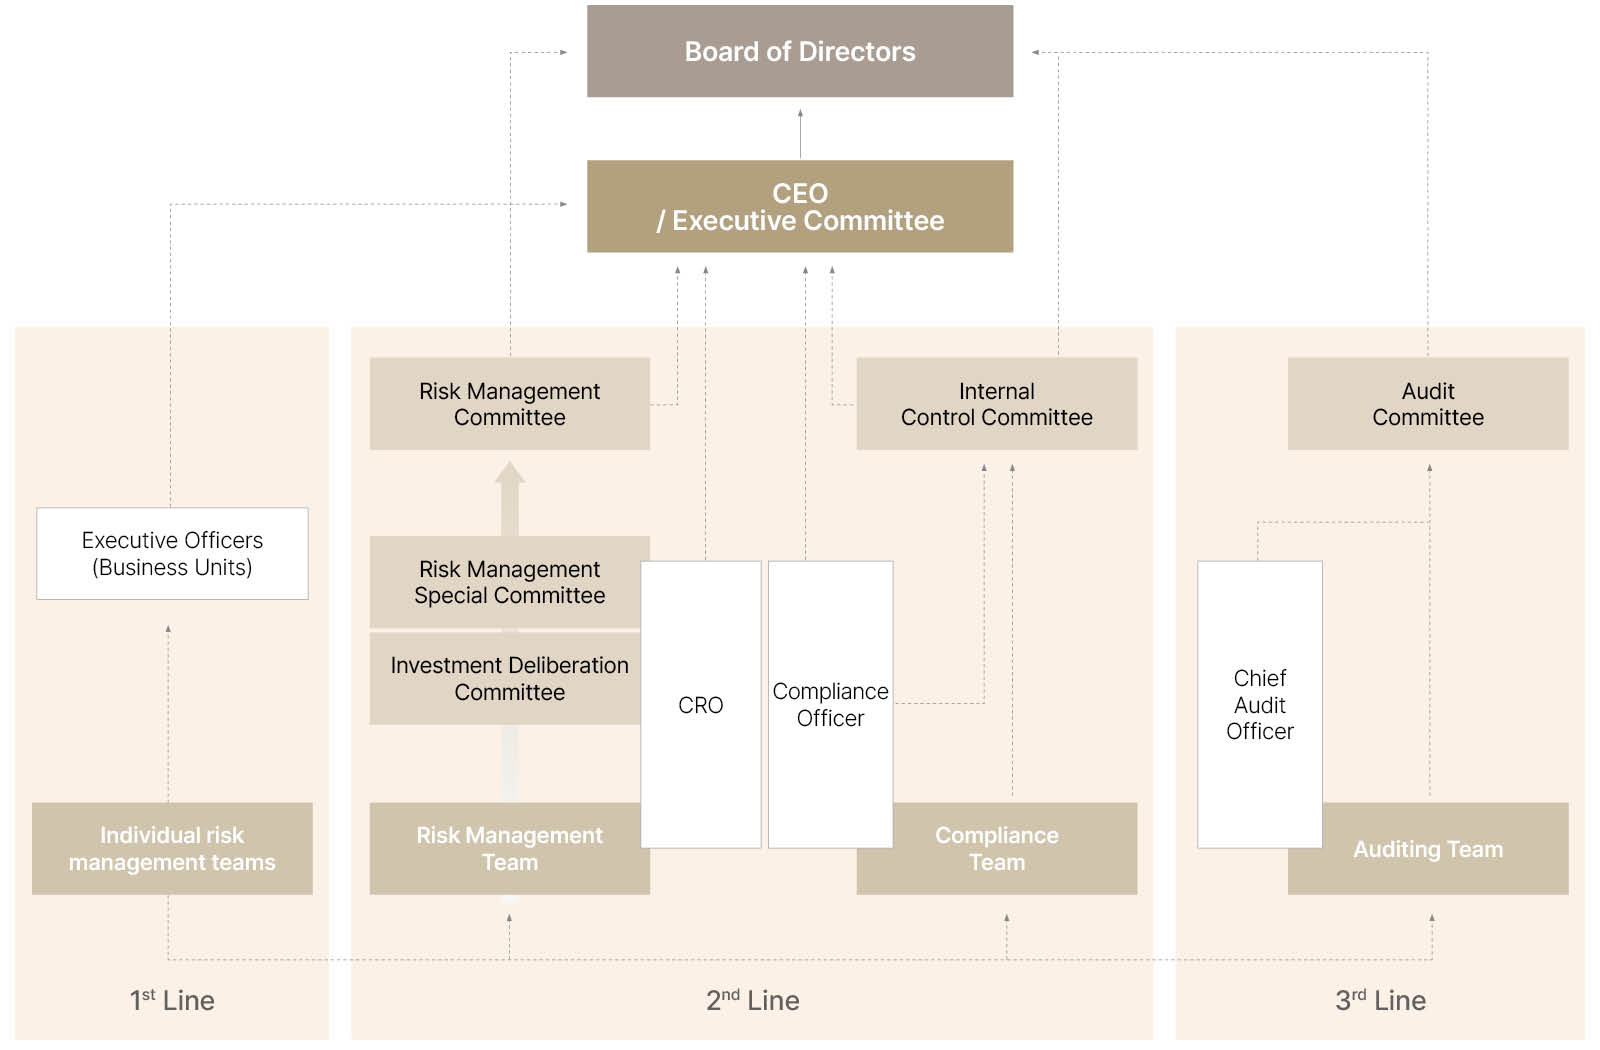
Korean Re has built a comprehensive framework for risk governance based on central oversight and controls of risks with clear accountability. This structure supports risk-based decision-making and oversight across all operations of our businesses. Risk governance defines the roles and responsibilities of the Board of Directors, committees, management structures, and related teams. It also involves the implementation of three lines of defense as part of the structure.
The Three Lines of Defense model that we implement demonstrates our risk governance, laying out the roles of business and oversight organizations in managing our risk profile. The first line of defense includes front-line managers and staff who are responsible for day-to-day risk management and decision-making. (Overseas office staff are also a first line of defense.) Their primary responsibility is to maintain an effective control environment and ensure that all activities are within our risk appetite. The second line of defense deals with setting risk policies and overseeing our risk management status. This involves the Risk Management Team, the Chief Risk Officer (CRO), the Risk Management Committee (RMC), the Risk Management Special Committee (RMSC), the Investment Deliberation Committee, and compliance functions, that is, the Compliance Team, the Compliance Officer, and the Internal Control Committee. The third line of defense provides independent assurance through an internal audit and validates the effectiveness of the first and second lines of defense in fulfilling their responsibilities and managing our risk profile.
█ Three Lines of Defense
Risk Landscape of Korean Re
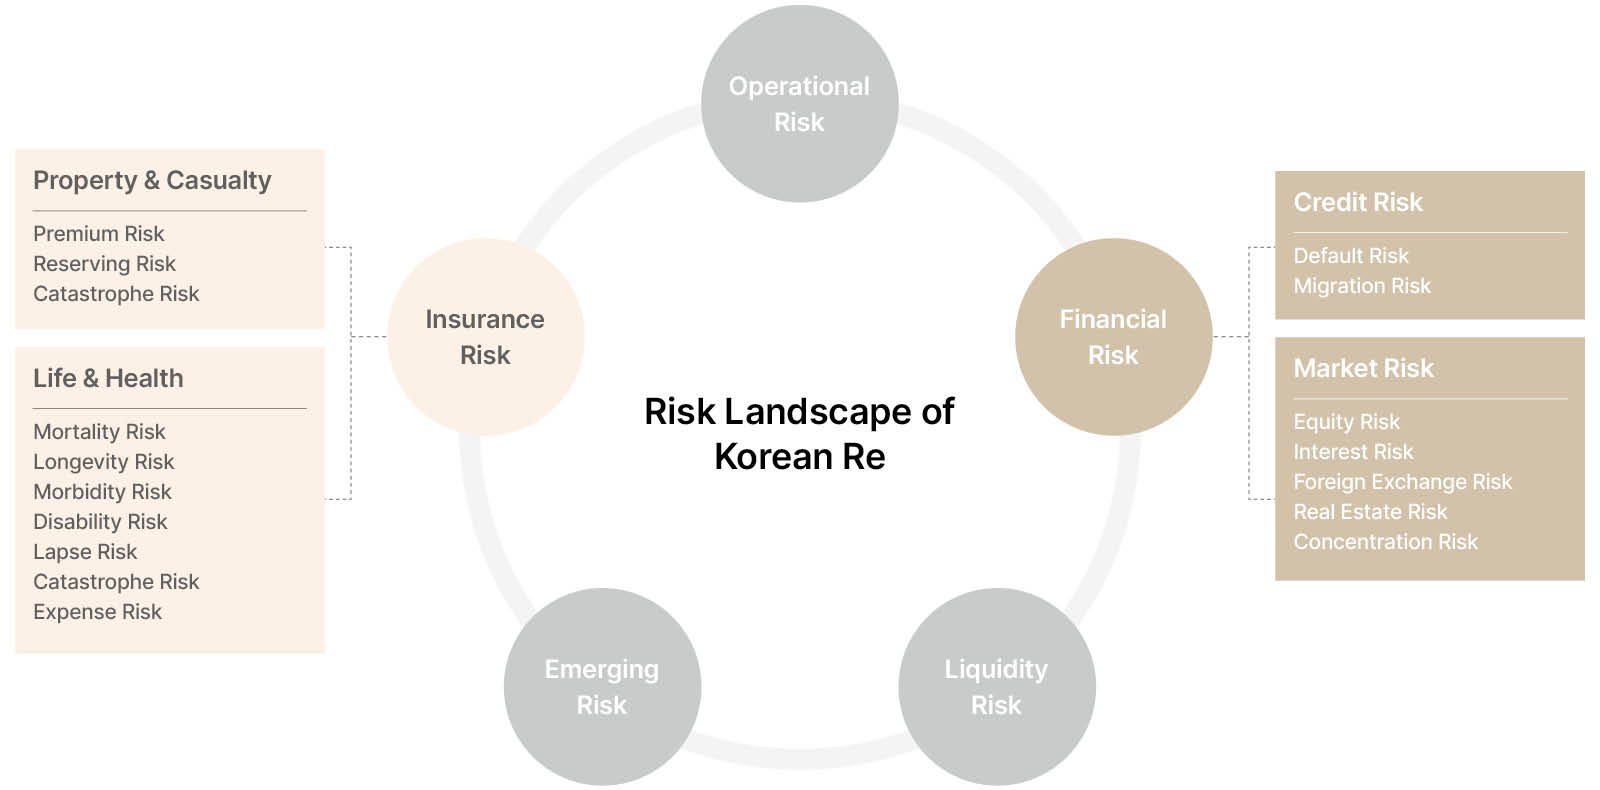
In the course of its business operations, Korean Re is confronted with a wide range of risks. These risks are consciously embraced, guided, and monitored in line with the actions taken toward the corresponding opportunities. The Board of Management’s parameters and decisions regarding Korean Re’s risk appetite, which are grounded in risk-bearing capacity calculations, are essential for risk acceptance.
In this regard, our risk management plays a pivotal role in ensuring that risks to the reinsurance portfolio remain measurable and that even extraordinary major losses do not excessively impact the outcome.
█ Risk Landscape of Korean Re
Key Risks
We manage five key risks—insurance risk, financial risk (credit & market), liquidity risk, emerging risk, and operational risk (which includes strategy, reputation, regulation and legal risks)—all of which are likely to have a significant impact on our financial results and/or operational viability. In doing so, we implement a series of procedures that include risk identification, measurement, control, analysis, and reporting.
Insurance Risk
Korean Re defines insurance risk as the risk of unexpected financial losses arising from the inadequacy of premiums or reserves for natural catastrophe or non-catastrophe events, or from the unpredictability of biometric risks, such as the mortality rate.
We manage insurance risks in a consistent manner across the company by assessing and monitoring them in accordance with clearly defined underwriting guidelines. Furthermore, we utilize a natural catastrophe modeling program and an accumulation management system to effectively control catastrophe risk at the corporate level.
Market Risk
Korean Re defines market risk as the risk of losses arising from fluctuations of the value of assets and liabilities due to changes in relevant factors, such as interest rates, stock prices, and foreign exchange rates.
We manage this risk in our day-to-day operations and, more specifically, hedge against foreign exchange risk using derivatives in order to keep our exposure at a safe level. At the same time, we closely monitor global economic and financial market conditions and outlooks that can affect our investment performance in order to analyze their potential impact and come up with effective countermeasures.
Credit Risk
Our credit risk system focuses on any losses arising from the failure of the counterparty to a reinsurance contract to meet its contractual obligations or from deterioration in the credit quality of invested assets.
We conduct an analysis of potential losses before making any high-risk business decisions, including whether to write new business contracts or invest in derivatives. When necessary, these decisions are made through the review process of the Risk Management Special Committee and the Investment Deliberation Committee. Identifying any abnormal signs related to retained risks is also an essential element of our preemptive risk management system.
Liquidity Risk
Korean Re defines liquidity risk as the risk of incurring losses from abnormal asset disposals or high-interest funding due to sudden cash outflows. We plan and manage our liquidity positions to ensure we can meet future claims payments and expenses as they arise. To this end, we set liquidity limits based on our future cash flow and monitor them regularly. Generally, our liquidity is managed based on short-term and mid-term working capital management plans by the Accounting Team and Investment Strategy & Operations Team. On this basis, we regularly monitor the liquidity status of the company.
We also manage liquidity risk through the regulatory liquidity ratio and S&P liquidity ratio to meet short-term and future payment obligations. Specifically, we establish our tolerance and limit based on our S&P liquidity ratio, which is measured by dividing stressed liquid assets by stressed insurance liability outflows. We set and manage the minimum liquid asset level on an ongoing basis to meet our daily business obligations, settlements, and expenses in a normal situation.
Operational Risk
Korean Re defines operational risk as the risk of potential losses arising from inadequate or failed internal processes or systems or human errors, and/or from external events. We have identified a set of operational risks that cover various business units and activities, including strategy, reputation, new product development, and claims management. We manage these risks through effective policies and procedures that have a clear separation of duties, timely internal controls, and reporting systems. Through the internal control system, operational risks are managed systemically based on our Code of Conduct and other internal regulations.
Emerging Risk
Emerging risks are defined as types of risks that were either not recognized or not considered of significant interest in the past, but have started to gain attention due to evolving environmental, technological, and/or socio-economic developments.
Our approach to managing emerging risks involves a comprehensive analysis, and each team establishes management strategies for their respective risks based on a detailed analysis report on potential emerging risks.
The emerging risks that we have identified for 2026 are as follows:
• Extreme Heat
· Increased composite risks across health, infrastructure, productivity, and financial markets due to extreme heat may have growing long-term and structural impacts on underwriting risk assessment and reserves.
· Extreme heat may also trigger large-scale losses across all insurance sectors, including both Property & Casualty and Life & Health (e.g., wildfires, crop damage, structural cracks, road damage, livestock/aquaculture mortality, and a surge in health insurance claims due to higher mortality and hospitalization rates).
• AI & Disinformation
· Rising AI-related litigation risks, involving issues such as data contamination, deepfakes, autonomous driving, and AI-related medical malpractice
· Data breach incidents where vulnerabilities in legacy software systems are exploited, including the exposure of personal information
· Increasing complexity in underwriting models, risk management frameworks, and pricing strategies due to the rising frequency and severity of cyber-related incidents.
By proactively identifying and addressing these emerging risks, we aim to enhance our resilience and ensure the effectiveness of our risk management strategies. These efforts align with our commitment to staying ahead of evolving challenges and safeguarding the interests of our stakeholders.