Review of Operations
Note: This section covers business results for the head office only, with gross written premiums used to measure business volume and the combined ratio calculated under IFRS 4.
Note: This section covers business results for the head office only, with gross written premiums used to measure business volume and the combined ratio calculated under IFRS 4.
In 2025, the capital markets were supported by improving corporate earnings and growing expectations of policy rate cuts. Equity markets delivered strong performance, while moderating inflation contributed to a gradual recovery in fixed income markets. However, elevated U.S. equity valuations and concerns over a potential economic slowdown continued to weigh on overall market sentiment, sustaining a degree of uncertainty.
Against this backdrop, we implemented an asset management strategy designed to balance profitability and capital efficiency, taking into account the potential for interest rate declines and regulatory considerations related to K-ICS. We increased our allocation to fixed income assets to enhance portfolio stability, selectively managed alternative and loan investments, and gradually expanded our equity exposure to improve returns. In addition, we improved overall funding efficiency by reducing short-term funds and optimizing the management of foreign currency assets.
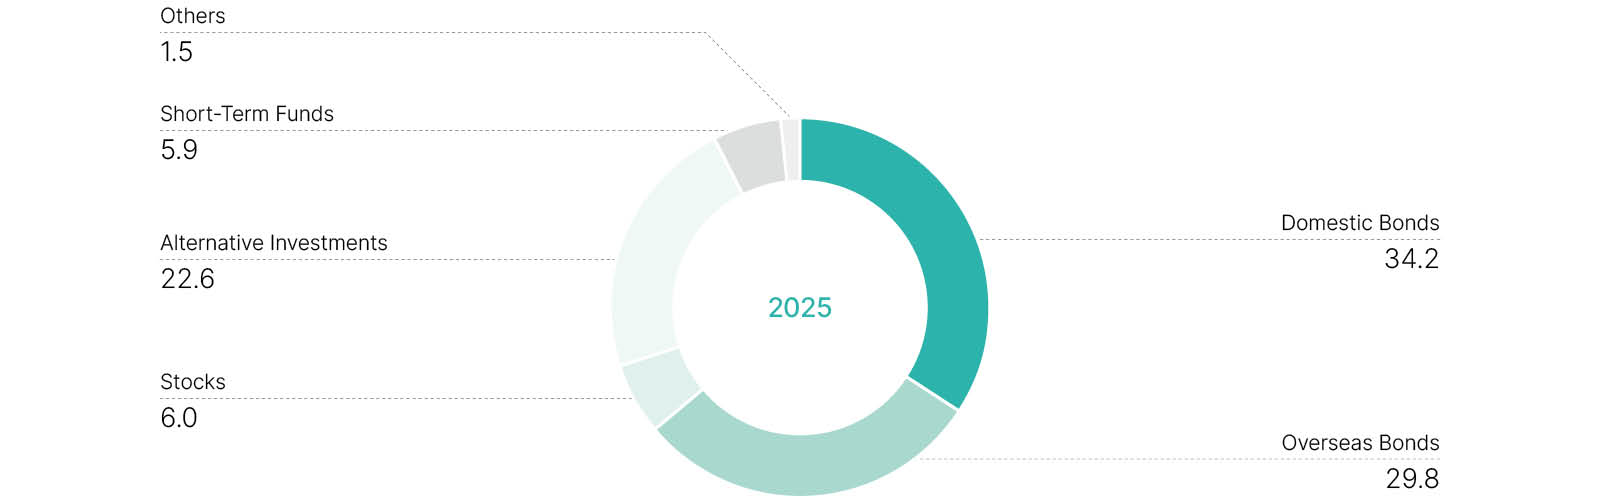
As a result, total investment income increased by 22.7% to KRW 474.9 billion, while total invested assets grew by 9.4% to KRW 11.68 trillion, reflecting effective portfolio management. As of year-end, bonds accounted for 64% (approximately KRW 7.48 trillion) of total invested assets, while alternative investments, including loans, comprised 22.6% (KRW 2.65 trillion), demonstrating portfolio adjustments aligned with our risk management strategy.
In the U.S., economic conditions showed mixed signals amid moderating inflation and policy adjustments by the Federal Reserve. Although policy rate cuts were implemented gradually, financial market volatility persisted due to uncertainties regarding the direction of monetary policy, increased government bond issuance, and geopolitical risks. Equity markets remained sensitive to developments in the technology sector and global trade policies, while bond markets fluctuated in response to shifting expectations for the pace of rate cuts.
In Korea, GDP growth stood at 1.0% in 2025, reflecting a modest recovery driven by exports and domestic demand, although structural economic challenges remained. The Bank of Korea adjusted its policy rate in consideration of both domestic and global economic conditions. In this environment, insurers strengthened investment diversification and risk management frameworks to respond effectively to changing financial market conditions.
The growth in our investment assets and operating income was driven by two key factors. First, net inflows from insurance operations amounted to approximately KRW 732 billion, expanding our investment capacity. Second, foreign exchange valuation gains of KRW 66.9 billion arising from exchange rate movements contributed to strengthening our financial position.
Bond investments delivered solid performance in 2025, with domestic bonds generating KRW 143.0 billion in returns and overseas bonds producing KRW 135.8 billion in investment income. Relatively high interest rates also had a positive impact on interest earnings.
During the second half of the year, we increased our allocation to domestic equities, generating KRW 64.8 billion in investment income.
Meanwhile, alternative investment income amounted to KRW 128.6 billion. Although we moderated the pace of new alternative investments amid continued global uncertainties, stable interest and dividend income supported overall portfolio stability.
(Units: KRW billion, USD million)
| 2025 (KRW) | 2025 (USD) | 2024 (KRW) | 2024 (USD) | |
| Invested Assets | 11,684.0 | 8,064.1 | 10,680.2 | 7,195.0 |
| Investment Income 2) | 474.9 | 331.1 | 387.1 | 282.9 |
| Investment Income 3) | 507.3 | 353.7 | 657.6 | 480.6 |
| Yield (%) 2) | 4.3 | 4.3 | 3.9 | 3.9 |
| Yield (%) 3) | 4.6 | 4.6 | 6.7 | 6.7 |
1) Investment results are based on IFRS 9
2) Excluding the insurance finance result and gains/losses from foreign exchange and interest rate hedging for insurance liabilities
3) Excluding the insurance finance result
Looking ahead, the global economy is expected to experience moderate growth alongside stabilizing inflation. However, uncertainties related to monetary policy normalization, geopolitical risks, and fiscal policy changes are likely to persist. Domestically, gradual economic stabilization is anticipated, but exchange rate volatility and structural economic challenges remain key risk factors.
Against this backdrop, our 2026 investment strategy focuses on achieving stable growth and enhancing risk-adjusted returns in an environment characterized by slowing global growth and a gradual monetary easing cycle. While major economies are expected to maintain accommodative policy stances, market volatility will likely be here to stay due to structural growth constraints, geopolitical risks, and the potential resurgence of inflationary pressures.
In this context, we will continue to advance our mid-term Strategic Asset Allocation (SAA) framework. Taking into comprehensive consideration capital regulations and international credit rating requirements, we will refine the optimal portfolio mix and seek to enhance profitability relative to current allocations. Through these efforts, we aim to improve long-term expected returns, strengthen capital efficiency, and establish a portfolio structure aligned with regulatory standards and credit rating considerations.
(Units: KRW billion, USD million)
| 2025 (KRW) | 2025 (USD) | 2024 (KRW) | 2024 (USD) | |
| Domestic Bonds | 143.0 | 99.7 | 145.8 | 106.5 |
| Overseas Bonds | 135.8 | 94.7 | 93.9 | 68.2 |
| Stocks | 64.8 | 45.2 | 7.7 | 5.6 |
| Alternative Investments 1) | 128.6 | 89.7 | 124.3 | 90.8 |
| Short-Term Funds | 18.4 | 12.8 | 27.9 | 20.4 |
| Others | -15.7 | -11.0 | -11.9 | -8.7 |
| Total (excluding derivatives) |
474.9 | 331.1 | 387.1 | 282.9 |
| Derivatives 2) | 32.4 | 22.6 | 270.5 | 197.7 |
| Total | 507.3 | 353.7 | 657.6 | 480.6 |
1) Alternative investments include loans and structured notes.
2) Gains and/or losses from foreign exchange and interest rate hedging for insurance liabilities
* Individual figures may not add up to the total shown due to rounding.
(Units: KRW billion, USD million)
| 2025 (KRW) | 2025 (USD) | 2024 (KRW) | 2024 (USD) | |
| Domestic Bonds | 3,995.2 | 2,757.4 | 3,833.8 | 2,582.7 |
| Overseas Bonds | 3,486.0 | 2,406.0 | 2,804.7 | 1,889.5 |
| Stocks | 695.5 | 480.0 | 389.4 | 262.3 |
| Alternative Investments (including loans) |
2,645.4 | 1,825.8 | 2,274.6 | 1,532.3 |
| Short-Term Funds | 691.7 | 477.4 | 1,203.3 | 810.6 |
| Others | 170.2 | 117.5 | 174.4 | 117.5 |
| Total | 11,684.0 | 8,064.1 | 10,680.2 | 7,195.0 |
* Individual figures may not add up to the total shown due to rounding.
(Units: %)